When the Ruler Itself Is Wrong: Uncovering the Hidden Costs Inside Your Measurement Infrastructure

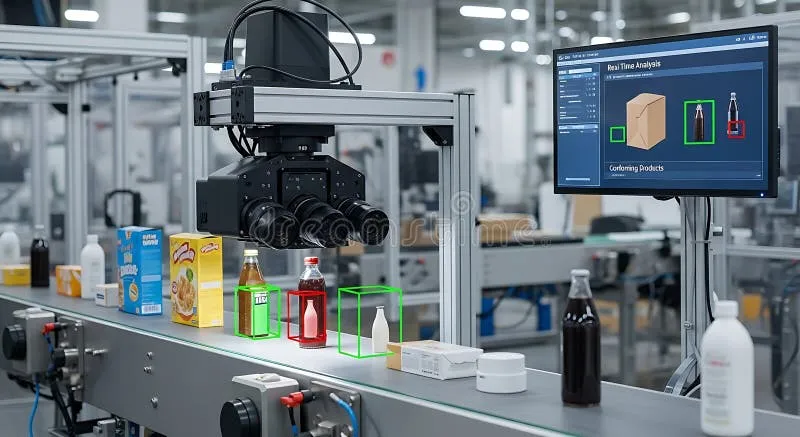
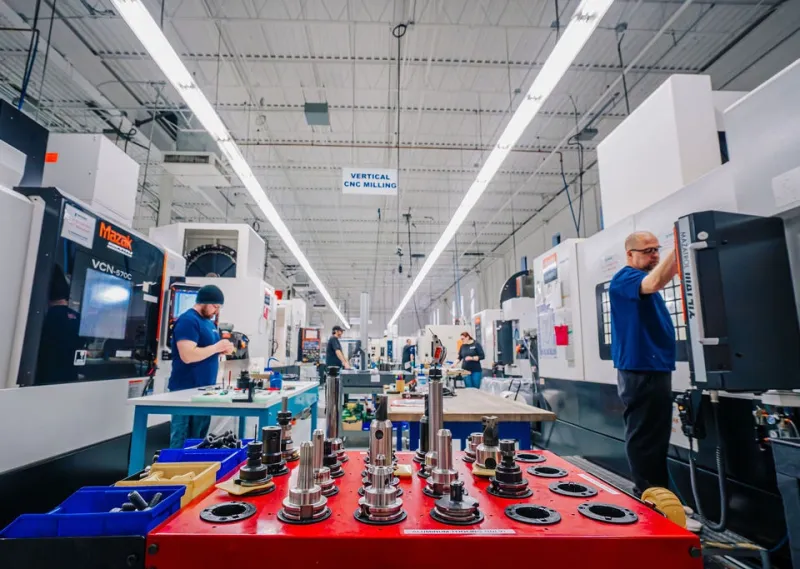
Photo: U.S. Air Force photo by Senior Airman Devlin Bishop, Public domain, via Wikimedia Commons
There is a foundational assumption embedded in almost every quality program in US manufacturing: the instruments doing the measuring are telling the truth. Defect rates are tracked, corrective actions are issued, and engineering reviews are convened — all on the premise that the data feeding those decisions is sound. But what happens when the measurement infrastructure itself is the problem? What happens when the ruler is wrong?
For a significant number of manufacturing operations, this is not a hypothetical scenario. It is an ongoing, undetected drain on productivity, yield, and customer confidence. The discipline of measurement system analysis, commonly referred to as MSA, exists precisely to surface these failures — yet it remains underutilized in practice, often treated as a compliance checkbox during an APQP cycle rather than a recurring operational audit.
This article examines how manufacturers can approach MSA as a genuine cost-reduction tool, where the most consequential losses tend to hide, and how to distinguish measurement investments that generate real ROI from those that have simply accumulated over time as legacy overhead.
The Difference Between a Defect Problem and a Measurement Problem
When scrap rates climb or a customer returns parts, the instinctive response is to interrogate the process — tooling wear, material variation, machine calibration. Rarely does the investigation begin by asking whether the gauge reporting the out-of-tolerance condition is itself performing reliably.
This distinction matters enormously. A measurement system that exhibits excessive variation can misclassify conforming parts as defective, driving unnecessary rework and scrap costs. It can also pass nonconforming parts through inspection, creating downstream quality escapes and warranty exposure. Both failure modes are expensive. Both are invisible without deliberate analysis.
MSA quantifies several distinct sources of measurement error. Gauge repeatability captures how consistently a single operator measures the same part with the same instrument across multiple trials. Gauge reproducibility captures how much variation exists between different operators using that same instrument. Together, these form the Gauge R&R statistic — a ratio of measurement variation to total observed process variation. Industry benchmarks generally require this ratio to fall below ten percent for a measurement system to be considered capable. Systems between ten and thirty percent are marginal. Above thirty percent, the measurement system is effectively unreliable for process control decisions.
For many operations that have never formally conducted a Gauge R&R study on their inspection assets, the results of an initial audit are sobering.
Where Calibration Drift Creates Silent Financial Exposure
Calibration schedules in most facilities are built around time intervals — instruments are pulled and certified every six or twelve months according to a fixed calendar. This approach addresses the administrative requirement of traceability but does not account for the actual behavior of instruments in service.
High-cycle gauges used on production lines may drift meaningfully between calibration intervals. Instruments subjected to thermal variation, vibration, or physical handling may lose accuracy well before their scheduled recall date. The financial consequence is not simply the cost of recalibrating an out-of-tolerance instrument — it is the accumulated cost of every quality decision made on unreliable data during the interval between when drift occurred and when it was detected.
A more defensible approach ties calibration frequency to usage cycles and environmental conditions rather than calendar time alone. Some organizations implement in-process verification routines using certified reference standards, allowing operators to confirm instrument stability at the start of each shift without waiting for a formal calibration event. This practice compresses the window of exposure and provides a documented record of instrument performance that a calendar-based system cannot offer.
Operator Variability: The Underestimated Human Factor
Even when instruments are performing within specification, the humans using them introduce variation that can be substantial. Differences in how operators position a part in a fixture, apply gauging pressure, read an analog scale, or interpret a borderline digital reading all contribute to reproducibility error.
This is not a reflection of operator competence. It is a reflection of system design. When measurement methods are insufficiently standardized — when the procedure for using a given instrument relies on tacit knowledge rather than documented technique — variability between operators is structurally guaranteed.
A well-designed MSA audit isolates this contribution by having multiple operators measure the same set of parts under controlled conditions. Where reproducibility error is found to be the dominant component of total gauge variation, the corrective action is typically procedural rather than instrumental: clearer work instructions, standardized fixturing, revised training, or in some cases a transition to more automated measurement methods that remove operator influence from the equation entirely.
Redundant Inspection Touchpoints and the Cost of Organizational Inertia
Beyond instrument performance and operator variability, a third category of measurement system cost is structural: the accumulation of inspection steps that no longer serve a defensible purpose but persist because removing them requires deliberate organizational effort.
This pattern is common in facilities that have grown through acquisition, expanded their product lines significantly, or responded to past quality escapes by adding inspection gates that were never subsequently re-evaluated. The result is a measurement infrastructure that is heavier than the product risk profile justifies — consuming floor space, inspection labor, and cycle time without a proportionate reduction in quality risk.
An honest audit of inspection touchpoints asks a straightforward question for each step: what specific failure mode does this inspection catch, and what is the actual probability and cost of that failure mode reaching the next stage undetected? Where that analysis reveals that a given inspection step is catching defects at a negligible rate while consuming significant resources, there is a legitimate case for consolidating or eliminating it — provided the process controls upstream are genuinely capable.
This is not an argument for reducing rigor. It is an argument for allocating measurement resources where they provide the highest return, rather than distributing them according to historical precedent.
Building a Measurement Investment Framework That Reflects Actual Risk
The organizations that extract the most value from their quality infrastructure are those that treat measurement as a resource allocation problem, not a compliance obligation. They ask which critical-to-quality characteristics carry the greatest consequence if measured incorrectly, and they concentrate their most capable, most recently calibrated, and most thoroughly validated measurement systems on those characteristics.
For lower-risk dimensions and attributes, they accept proportionally less measurement precision — a rational trade-off that frees resources for higher-value applications. They conduct Gauge R&R studies not just during new product launches but as a recurring operational practice, particularly when personnel change, instruments are repaired, or process conditions shift.
They also maintain a living inventory of their measurement assets that includes not just calibration status but performance history — a record that enables them to identify instruments that repeatedly drift out of tolerance, operators whose reproducibility scores are outliers, and inspection steps whose defect-catch rates have declined to the point where their cost-benefit case can no longer be sustained.
The Audit as a Starting Point
For manufacturers who have not yet conducted a systematic MSA audit of their quality infrastructure, the starting point is simpler than it may appear. Select a representative sample of high-use gauges. Identify the operators who use them most frequently. Run a structured Gauge R&R study. Compare the results against the ten-percent and thirty-percent thresholds. Map the findings against your current calibration intervals and inspection procedures.
What that exercise reveals will vary by operation. But in our experience, it rarely reveals that the measurement infrastructure is performing exactly as assumed. More often, it surfaces specific, addressable gaps — instruments that warrant more frequent verification, procedures that need standardization, and inspection steps that deserve a harder look.
The parts your quality system is catching are visible. The costs your measurement system is generating are not — until you decide to look.